On December 10, 2025, we hosted a live webinar titled “2025 Tech M&A Wrapped”. The webinar was presented by Marcin Majewski, Managing Director and Filip Drazdou, M&A Director.
You can now watch the full webinar replay below. If you would like to download the presentation material used during the session, you can easily do so by clicking the download report button on the left (if you are using a computer) or by scrolling at the very end (if you’re using a phone).
Marcin Majewski:
The first thing we wanted to cover, and probably the most exciting, is what’s happening with AI. The big question everyone seems to be asking is: are we in a bubble?
Is AI a bubble?
While preparing for this webinar, we looked for a good reference to frame the discussion. We found a bubble development framework, shown on the right side of the slide, and it really resembles the progression of our AI index. This index tracks the entire AI industry supply chain since the launch of ChatGPT.
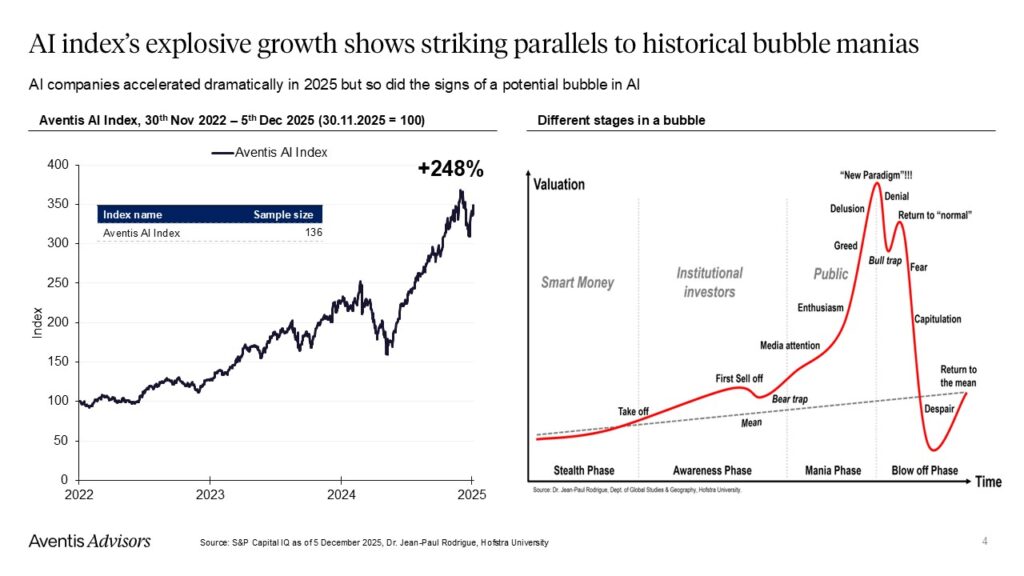
In 2023, we saw a long take-off phase as smart money began positioning for the coming AI revolution. There were a few sell-offs, with the biggest right after the Deep Sink announcement in early 2024. Then came a sharp climb starting around April, which pushed the index to record highs.
I don’t think there’s much debate about whether this is a bubble. The general consensus seems to be that it is. The real question is where we are in the bubble cycle. Have we already reached the “new paradigm” peak, where everyone believes we’re in a completely new reality? Or is there still more room to climb?
Looking at the chart, it seems like we may have hit that “new paradigm” point this summer. Then, after the summer break, around September or October, we saw a small correction. That could be the beginning of the decline phase. But every bubble develops differently, so it’s hard to say for sure.
Personally, I’m not convinced the burst will come in 2026. I tend to be conservative, and I’m a bit concerned that we might see the blow-off phase soon. A lot depends on external factors, especially ones unrelated to AI. For instance, if the Fed lowers interest rates significantly when a new governor is appointed, that could extend the bubble even further. But we won’t know until spring.
I’m very curious to see how this plays out.
Filip Drazdou:
Yeah, definitely. This is one of the most interesting points right now. When we created this chart, we didn’t expect it to align so closely with the classic bubble pattern, but it really does. We’ve seen the first sell-off, the “new paradigm,” and now what looks like a return to normal.
The next few months will likely determine if the index follows the right-hand side of the chart and starts to drop, or if we’re actually still on the left side and there’s more growth ahead.
I agree that it’s a bubble. That seems to be the general view among investors. The problem is, no one knows how long it will last. You don’t want to miss out on returns, but you also don’t want to be caught when it pops. So it’s a tough spot for everyone deciding whether to invest or not.
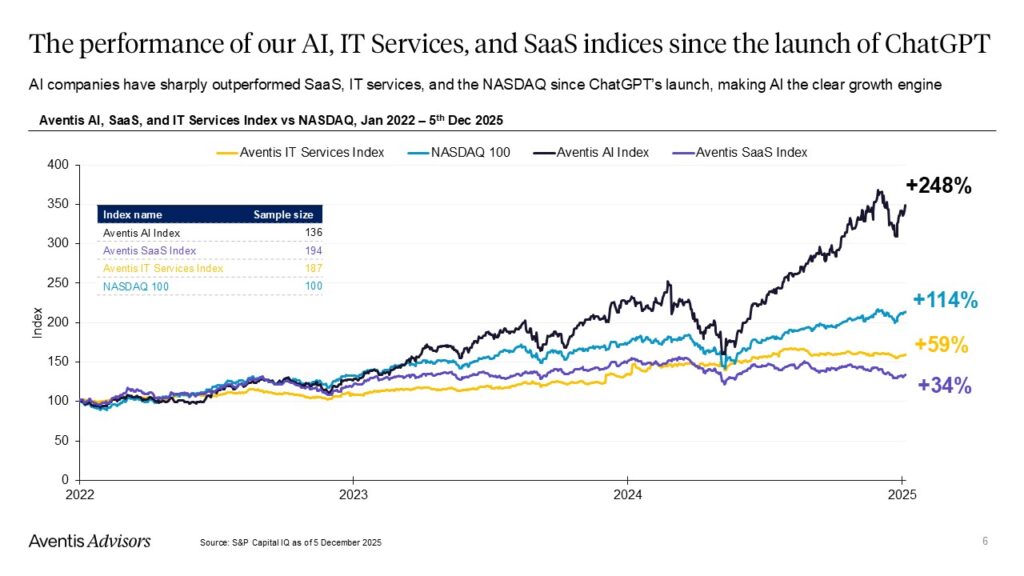
This bubble matters more than most because it impacts the rest of the market. Everything is so concentrated around companies like NVIDIA, Google, and Microsoft. Whatever happens with the AI trend will affect all of them.
When will the AI Bubble burst?
Marcin Majewski:
Exactly. Now we want to hear from you. What’s your take? We’ve set up a quick poll, and we’ll launch it now.
Filip Drazdou:
AI-related, yeah. Okay.
Marcin Majewski:
The poll is running. I’ll cast my vote—wait, I actually can’t. I need to stay unbiased. Let’s give it about 30 seconds.

I’m really curious to see what our subscribers and webinar participants think.
Filip Drazdou:
I already see some live results, but let’s give it a bit more time.
Okay, a minute has passed. We’ve got almost 70 percent turnout. I’m clicking finish now, and results should be visible.
Marcin Majewski:
Very interesting. 24 percent said 2026, 27 percent said 2027, and 36 percent said later than 2027. I’m also glad to see 20 percent answered “Bubble? What bubble?” I wish I could agree with that.
My gut says the first half of next year should still be good.
Filip Drazdou:
Yeah, and we haven’t seen much retail participation yet. Although, we did see a chart today from the Bank of International Settlements showing it’s starting to grow.
If we compare this to the last software bubble, like the GameStop episode, we’re still far from that kind of hype. Maybe once we see AI companies go public and turn into meme stocks, that’s when we’ll be near the top.
Marcin Majewski:
Yeah, I think there’s still some runway ahead. So 2026 should be a solid year for M&A. That makes sense.
Filip Drazdou:
We might just see this “return to normal” phase continue to climb for a while.
Marcin Majewski:
I agree. I don’t think we’ve reached the peak yet. Which is encouraging for the rest of today’s session. Let’s move on to the next topic.
2025 AI M&A and Fundraising Wrapped
Filip Drazdou:
So that’s what’s driving the index. All this capital is flowing into CAPEX, infrastructure, energy investments, chips, HVAC systems, electrical equipment—all the inputs for data centers.
The performance of many public tech companies is tied to this. If we expect markets to do well next year, and if we believe AI will continue to be the top-performing segment in tech, then we have to believe this funding will continue. We need to see more massive investments, both equity and debt.
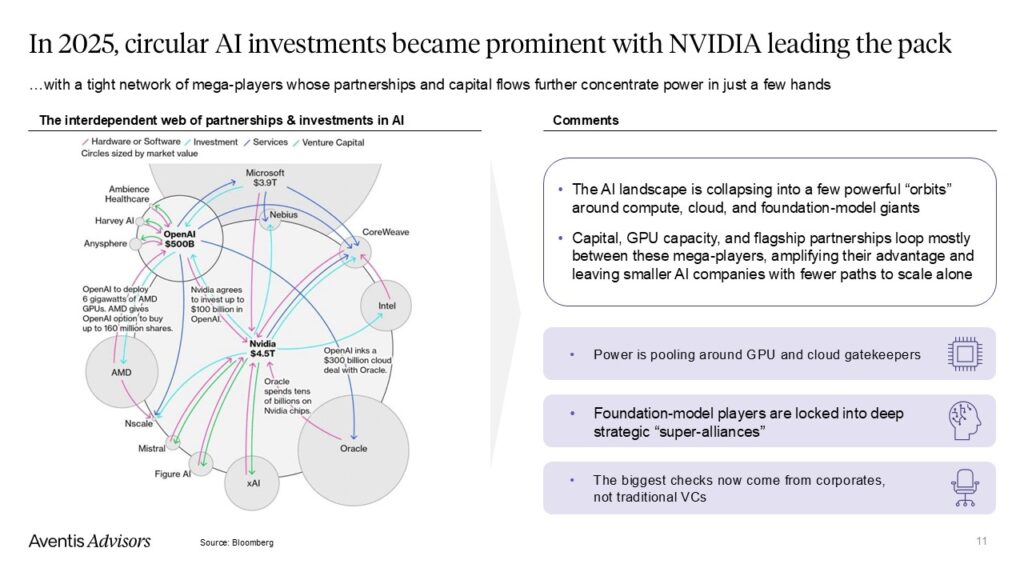
The next slide is about circularity, which Marcin already touched on. There’s a lot of funding going between related companies that are, at the same time, customers, suppliers, or investors in each other. That’s not very healthy. If it unravels, it could unravel fast.
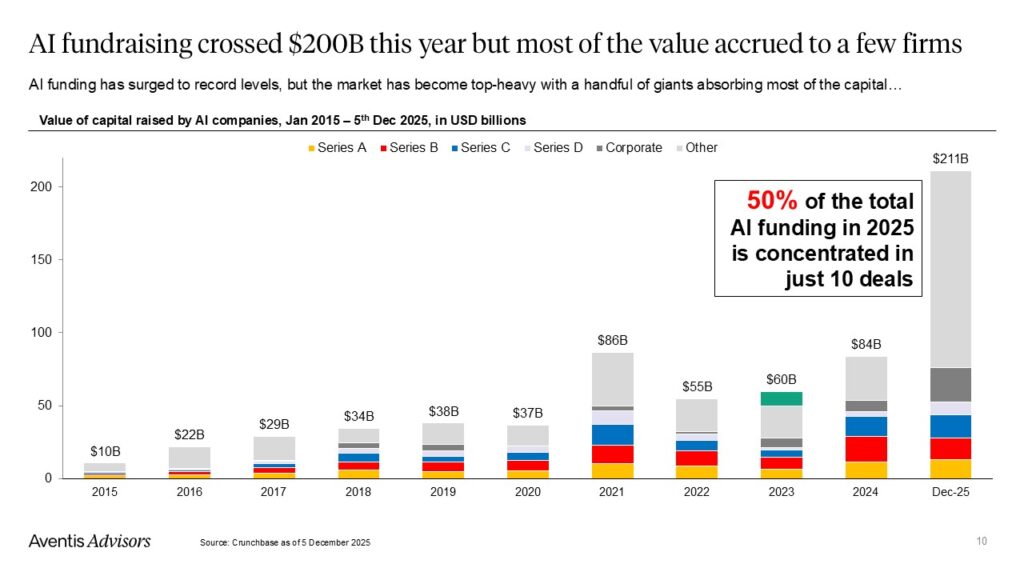
Some bubble theories also suggest that if much of the funding comes from debt, it makes the situation even more fragile. And we’re starting to see more capital raised through debt markets now.
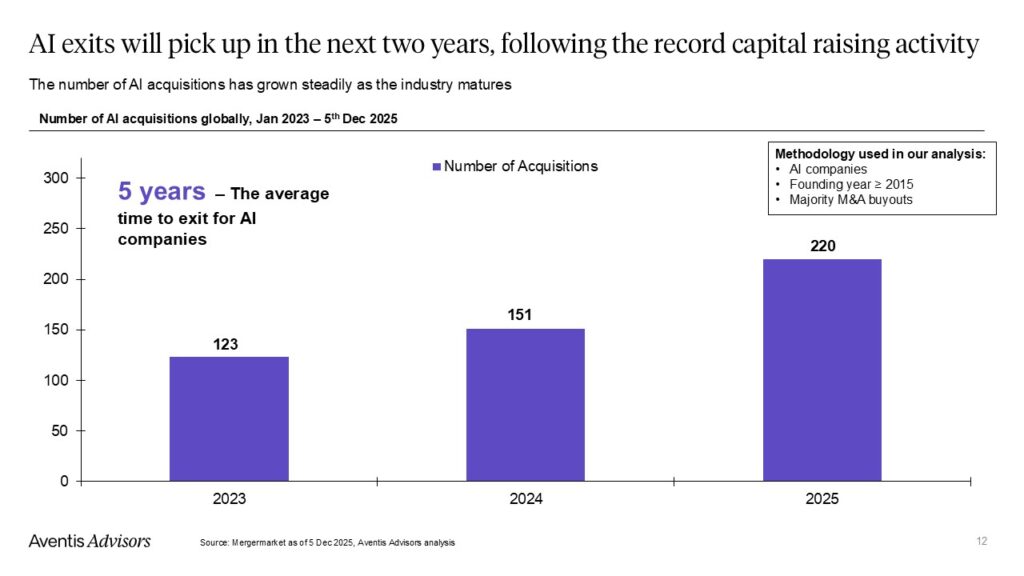
Then we looked at M&A. There’s a lot of capital out there, but what about full acquisitions? That market has also been strong in 2025. So far, we’ve seen 220 deals, with more expected to close by year-end.
Larger companies are actively acquiring AI firms—many of these are acqui-hires or tech-focused buys. I think that trend will continue in 2026. We’re already seeing big names making moves. Adobe recently bought SEMrush. IBM announced a deal with Confluence. The M&A market is active, and if the AI cycle continues, next year could be another record.
Marcin Majewski:
Yes, I also expect next year to be another year of strong growth. Based on our updated view that the bubble may burst in 2027, we should see peak activity then.
After that, the market might freeze. It’s important to plan around timing. If you’re thinking about an AI exit, there’s a window of opportunity that could shut quickly.
It’s smart to keep your options open. Listen to inbound offers, even if you’re not running a formal process. There are buyers out there. It’s worth hearing them out and having a few standby discussions, because you never know when the window will close.
Filip Drazdou:
I remember what it was like in 2020 and 2021. That was the peak for SaaS exits. The market was hot for about a year, and then things shifted fast.
Some deals still went through later, especially as private equity funds had dry powder to deploy. But now the SaaS exit market is much quieter.
Marcin Majewski:
Yes, and we’ll get into that next.
2025 IT Services M&A Wrapped
Filip Drazdou:
Now let’s talk about IT services and what happened in 2025. Here we’re showing the median EV/EBITDA multiples for software development and IT consulting companies.
Software development includes firms like EPAM Systems, Endava, and Globant—mostly offshore engineering companies that grew quickly during COVID, doing product and software development.
IT consulting refers to more traditional companies like Accenture, Cognizant, and CGI. The theme this year, and even the last couple of years, is convergence.
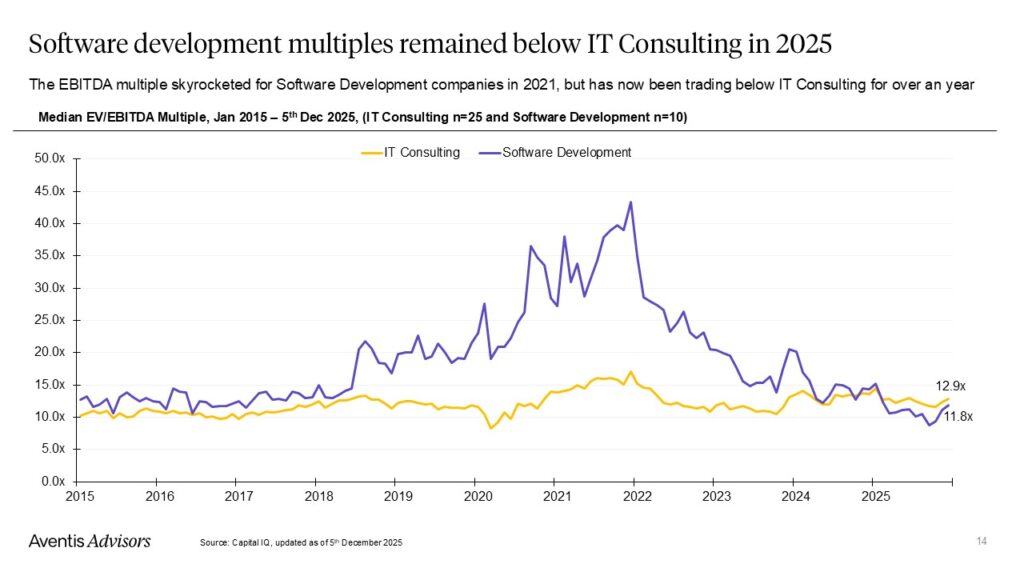
Investors have started to see both types of companies as part of one broader category: IT services. They’re being analyzed in similar ways now. Their growth rates and profitability are aligning. The services may differ, but the business model—time and materials, project-based—is similar.
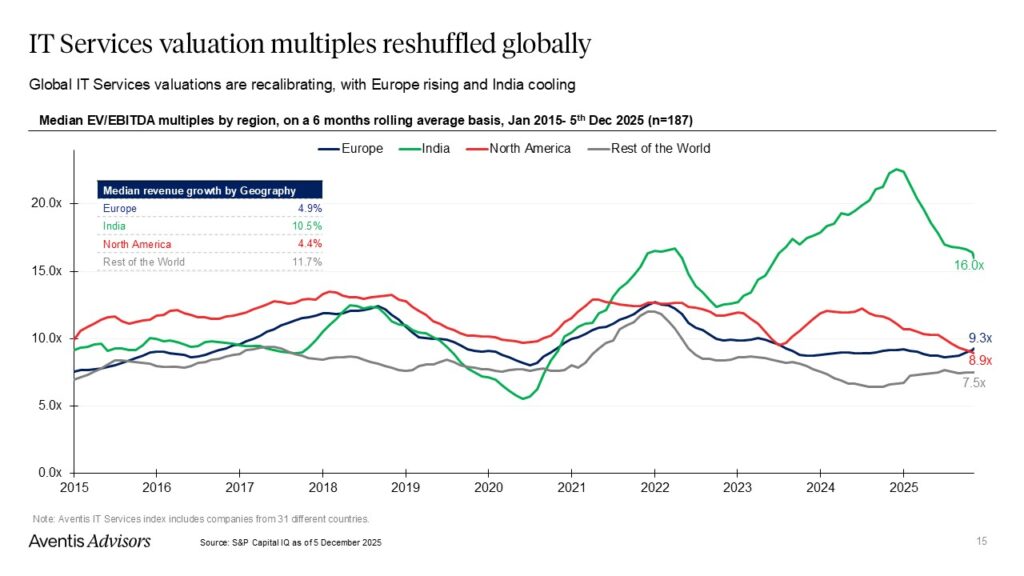
This convergence is also happening across geographies. Whether you’re in India, Europe, or North America, investors are valuing businesses more equally. Public companies are now trading around 10 times EBITDA, regardless of where they’re based or their exact model.
That said, some factors are becoming more important than others. On our next slide, we looked at what’s driving outperformance. While the sector may look flat overall, some companies are doing much better than others.
What matters is not geography or business model, but vertical focus. Industries like space and defense, cybersecurity, and healthcare have seen strong performance due to high demand and investment.
Meanwhile, generalist companies—those focused on generic software development or broad IT consulting—have declined. Much of that is due to valuation multiples coming down to more reasonable levels. At the peak, some companies were trading at 40 times EBITDA, based on unrealistic growth expectations.
Now things are settling. IT services businesses, both public and private, across the US and Europe, are seeing more aligned valuations.
Next, we summarize our current view on private valuations and what really matters for exits.
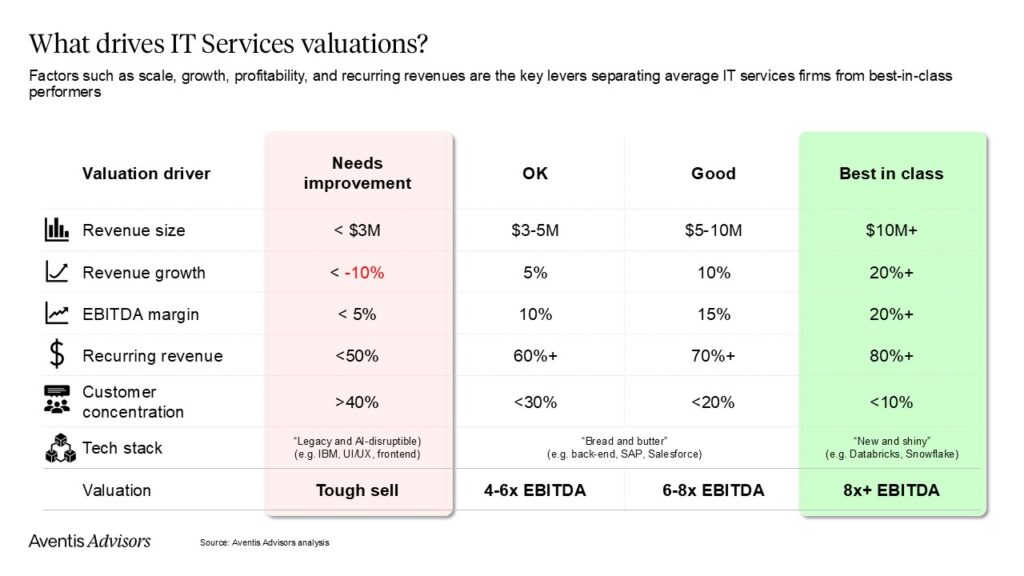
Revenue size is key. Larger companies attract more strategic interest. If you lack scale, it can be a long process to find a buyer.
Growth rate matters too. For IT services, anything above 20 percent is considered strong. But that’s hard to come by unless you’re aligned with a high-growth vendor, hiring aggressively, or in a hot vertical.
Profitability is also important. A 20 percent margin is top tier. Public companies used to average 15 percent, now they’re closer to 11. So if you’re hitting 15 percent or more, you’re doing well.
Recurrent revenue is another big factor. Project-based work is tough to sell because you constantly need to fill your pipeline. Long-term maintenance contracts with enterprise clients are much more attractive.
Customer concentration can hurt. Some companies have great metrics but rely on just one or two customers. That makes them harder to sell and often results in valuation discounts.
Finally, the technology stack matters a lot. It affects all the KPIs I mentioned above. If your tech stack isn’t in demand, growth is harder.
We broke it down into three categories. On the left, you have legacy or AI-disrupted areas like UI/UX front-end work. These are seen as low value or in decline.
In the middle are the staples: backend development, SAP, Salesforce, and other enterprise software integration.
At the top are fast-growing ecosystems like Databricks and Snowflake. Investors are very interested in acquiring partners working in these stacks. There’s more interest than there are scalable companies.
So that’s a quick summary of where we see the IT services market. Valuations are converging, location and model matter less, and internal metrics matter more. That’s my wrap-up for the year.
Marcin Majewski:
Yes. It’s interesting to see how the world is becoming more flat, especially in IT services, despite all the geopolitical tensions.
Also, the visa situation in the US has made offshore companies more attractive. That’s been a big shift.
We’re definitely seeing more interest in IT services again. The last two years weren’t great for small or midsize companies, or even large ones. But now many are starting to bounce back. Some picked up earlier this year, and they’re already seeing the results.
Marcin Majewski:
Some companies are already in recovery. Others are ramping up and hiring right now. It seems like demand has picked up again after a bit of a slump. Maybe it’s a bit of disillusionment with AI. It doesn’t solve everything, and at the end of the day, you still need people to get things done.
A lot of senior management spent time experimenting with AI tools, but many of those experiments didn’t deliver real results. Now actual work needs to get done, and people are coming back in to do it. That’s how I see it.
Filip Drazdou:
Yes, and another thing you mentioned earlier is how countries are converging. Rates are starting to look similar across the board. Countries that used to be considered cheap are catching up as salary growth pushes everything closer together.
IT services in places like Poland, Brazil, India, or the Philippines are essentially the same business now.
Marcin Majewski:
Exactly. There are still low-cost countries, and differences in cost of living mean salaries will vary. But if you look at the standard of living for software developers and consultants around the world, it’s quite similar.
Even if you’re earning five times more in San Francisco, the cost of living offsets it. So in real terms, the lifestyle ends up being pretty equal. That dynamic is really interesting.
Filip Drazdou:
Okay, moving on.
2025 SaaS M&A Wrapped
Marcin Majewski:
Right. Let’s talk about SaaS. What’s the future here?
We’re past the COVID boom. Valuations came back down, and at the start of 2025, we were hoping that was the bottom and things would stabilize. But actually, valuations kept declining.
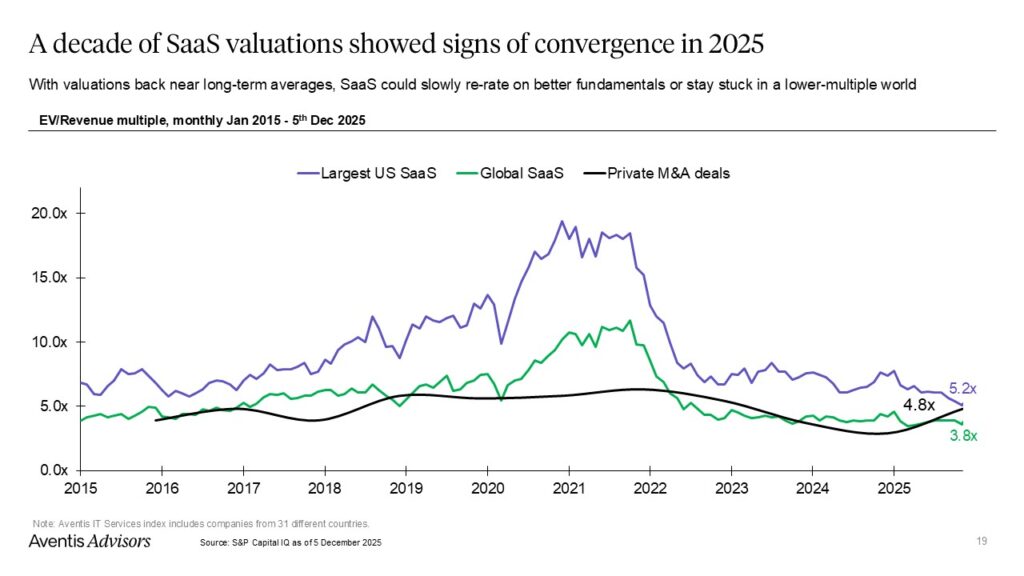
It’s understandable. Growth in SaaS has underwhelmed. Stocks are being repriced based on slower growth. There are a few reasons. One is saturation. Companies are already using a lot of SaaS tools, and there’s fatigue. AI hasn’t helped, because now it’s easier for both large and small companies to build tech in-house.
Large companies can also quickly replicate others’ products, so competition has increased. That’s not great for valuations.
Interestingly, we’ve seen a bit of an uptick in private M&A valuations. But my view is that’s because only the best-quality companies are getting acquired. The sample is small.
In the lower middle market, valuations are still depressed. We’re not seeing much recovery there.
At the higher end, the top SaaS companies are leading the way in AI adoption. That helps them get a bit of a premium, but for the rest, the sector has been heavily repriced. I expect that will continue.
In a year or two, if more companies start turning a profit, we’ll probably shift toward EBITDA multiples for valuation. But many SaaS firms are still not profitable, so revenue multiples are still being used.
Eventually, after the bubble fully bursts, I think we’ll see another wave of adjustment.
We actually did a whole webinar on how to position your SaaS business in this AI-disrupted environment. One framework we shared was a matrix showing which types of SaaS are more or less prone to disruption.
It’s important to understand where you fall on this. Consider your product’s complexity, your scale, how close you are to the customer, and whether your solution is mission-critical and handles sensitive data.
If your product is deeply integrated into workflows and customers rely on it, you’re likely safe and less prone to disruption.
On the other hand, if your product is easy to replicate, non-critical, and doesn’t handle sensitive data, then you’re at much higher risk. These companies are already struggling and will likely face even more pressure.
If you’re in high-risk segments—like marketing, sales, support, or customer service—it might be time to revisit your strategy. You may need to cut costs or consider a sale. Ideally, do both: reduce costs, then explore an exit.
If you’re in low-risk SaaS, gradually adopting AI might be enough to keep you stable and preserve your business.
So, it’s worth revisiting that previous webinar if you missed it.
Filip Drazdou:
I dropped out for a second, but I’m back.
Marcin Majewski:
No worries. Let’s move on to valuations.
Just like in IT services, investors are being highly selective. KPIs matter more than ever.
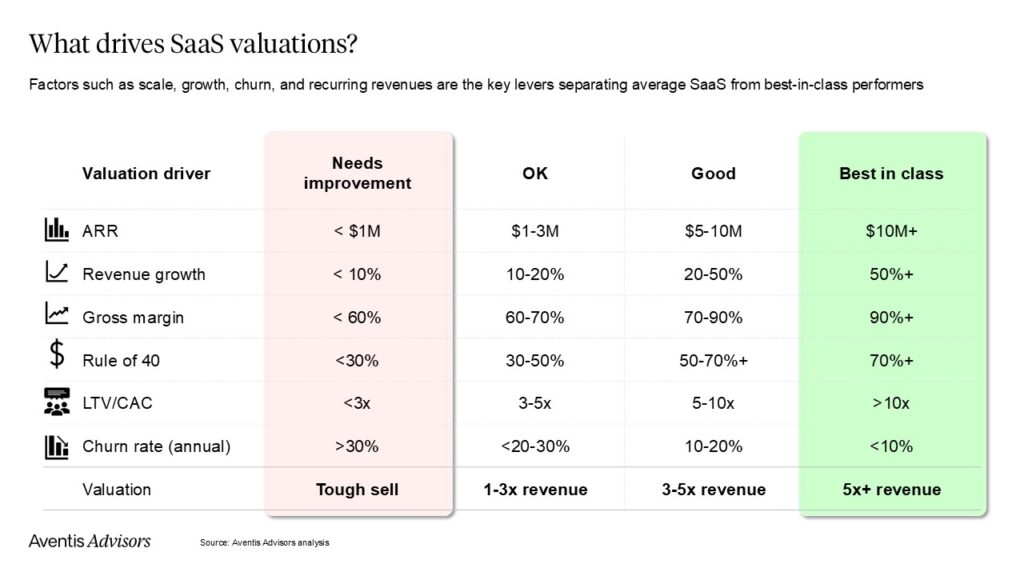
Probably the most important metric we look at is churn rate. It tells us how indispensable the product is. High churn—over 30 percent annually—makes a business really hard to sell. Under 10 percent is excellent and earns a valuation premium.
That’s usually the starting point in our SaaS discussions. There are ways to improve churn, so it’s something to focus on when prepping for a sale.
Another major factor is size. There’s a big valuation gap between companies with $1 to $5 million ARR and those with $10 million plus. Different investors are interested at those levels, and the level of engagement is very different. If you’re close to crossing that $10 million mark, it’s usually better to focus on growth than sell too early.
Revenue growth still matters, probably more than profitability. We haven’t seen that shift much in our conversations. The “Rule of 40” is still relevant, even if some say it’s outdated. Most large companies still track it, and for smaller firms, it makes a lot of sense.
Another key factor is how efficiently you spend on marketing. The LTV to CAC ratio is important. If it’s under 3, the business is hard to sell. Between 3 and 5 is acceptable but not exciting. Over 5 is good. Above 10 is excellent.
So, that’s our take on SaaS market conditions. We sometimes see higher or lower valuations than what I’ve mentioned—it all depends on the specific company.
That wraps up our view of where the market stands today.