On January 27, 2026, we hosted a live webinar titled “SaaS M&A KPIs: Calculating Churn the Right Way”. The webinar was presented by Filip Drazdou, M&A Director at Aventis Advisors.
You can now watch the full webinar replay below. If you would like to download the presentation material used during the session, you can easily do so by clicking the download report button on the left (if you are using a computer) or by scrolling at the very end (if you’re using a phone). To access the excel sheet used during the webinar, please check out this Google Sheet.
Below is the full transcript of the discussion, edited or paraphrased for clarity, flow, and briefness.
Filip Drazdou:
Hello and welcome everyone. I’m Filip, M&A Director at Aventus Advisors. We’re an M&A advisory firm primarily focused on technology companies – SaaS, software, IT services, and sometimes business services.
In the past, our webinars focused on valuations and broader industry trends – what’s happening with multiples, and so on. This time, we wanted to take a more practical approach and dig deeper into what really matters for SaaS founders and buyers. Specifically, we focused on KPIs in SaaS: how to calculate them correctly, what we’re seeing in the market, what’s going wrong, and how to analyze those metrics properly.
If you’re interested in our previous webinars, you can find recordings on our YouTube channel or website. Today, though, I wanted to focus on one of the most critical KPIs in SaaS: churn rate and its direct impact on valuations.
What is Churn?
We started by asking, “What are the key metrics driving SaaS valuations?” Company size, profitability, and growth are all important. But beyond those, there’s a whole ecosystem of SaaS KPIs: ARR, MRR, LTV, NRR, and so on. Among all of them, churn stands out as the most important.
Churn rate is often one of the first things we ask potential clients about. It tells us a lot. Buyers use it to qualify investment targets, to assess valuation multiples, and to understand unit economics. Straight and put simply, churn is the percentage rate at which SaaS customers cancel their recurring revenue subscriptions.
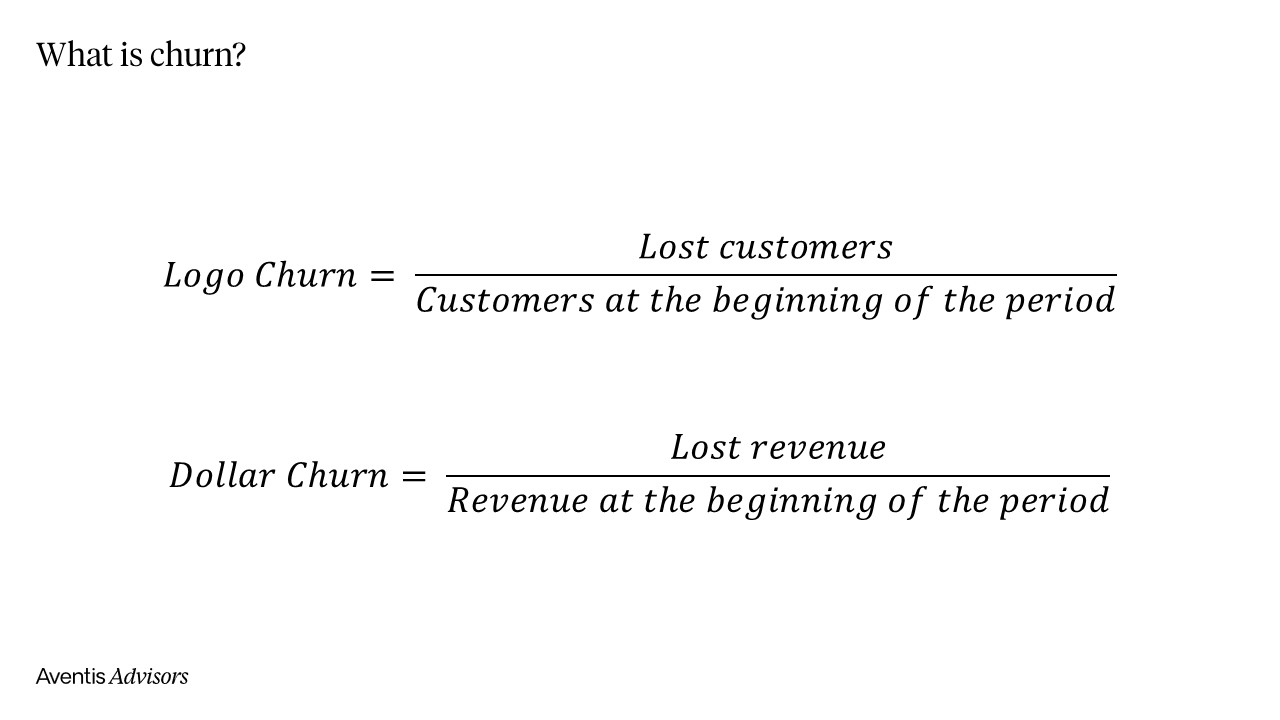
Two types of churn rates in SaaS businesses
There are two types of churn: logo churn, which measures the number of customers lost, and dollar churn, which looks at the lost revenue. I personally prefer dollar churn as it’s more useful for forecasting and should be prioritized by founders. Logo churn, while still helpful, serves better as a supplementary analysis, especially when comparing it with dollar churn to see whether large or small customers are churning.
Churn rate tells us so much about a business. If I see 5% annual churn, I can reasonably assume you’re targeting enterprise customers, which implies long customer lifetimes, maybe 20 years or more. That kind of churn often indicates high ACVs, longer sales cycles, and a sales-led GTM motion. On the other hand, a 15% monthly churn typically points to small business or B2C segments – lower ACVs, shorter customer lifespans, and a marketing-led, self-service model.

Neither model is inherently better; they’re just very different. But understanding churn gives immediate insight into your GTM strategy, customer type, contract size, and even how you’re structured internally.
Churn rate and profitability
Churn also affects how we think about profitability. In low-churn businesses, where customers stay for years, I’m less focused on short-term profitability. You might be investing heavily now to reap long-term gains, which makes sense. In contrast, high-churn models need to show profitability or at least clear unit economics much earlier. That’s because the lifetime value of each customer is shorter, so you need to see payback and returns faster.
It also changes how businesses scale. Enterprise-focused businesses often scale through account expansion, upselling, and deepening customer relationships. High-churn, low-ACV businesses scale through marketing, driving traffic, improving conversion rates, and building efficient acquisition funnels.
This is why churn is so important for investors. It gives a snapshot of where your business stands, allows us to infer other KPIs, and helps us know where to dig deeper during due diligence. For example, we wouldn’t focus heavily on your marketing if you have a low churn rate – we’d look at your sales team instead.
How churn affects valuation?
Churn also impacts valuation directly. Ultimately, all valuation comes down to a DCF (discounted cash flow), even when you’re using multiples. Churn affects both key inputs – growth and risk. High churn generally implies slower growth and higher risk, both of which depress valuation.
As you scale, churn becomes more problematic. Losing 20% of your customers early on may be manageable, but replacing that many customers at scale becomes increasingly difficult. Plus, if your growth engine, often marketing slows down due to algorithm changes or increased costs, revenue can quickly decline.
That’s why B2C and SMB SaaS businesses are often valued very differently. Many investors won’t even touch them unless they specialize in marketing-heavy models. These companies require a different kind of expertise – less product or operational focus, more marketing acumen.
To wrap up, we looked at a few example models showing how different churn levels dramatically impact growth over 12 to 24 months. Even small changes, say, from 2% to 4% monthly churn have a massive effect.

So, why does churn matter so much? Two reasons: it affects your ability to scale, and it reflects the underlying risk of your business.
In the next part of the session, I went into how to calculate churn correctly and how to present it to investors. It’s critical to track this internally and understand that even small differences in churn can lead to major changes in your valuation. One of the foundational rules I shared is to calculate your revenue on an accrual basis (annual contract revenue should be recognized evenly over 12 months.)
DOWNLOAD THE EXCEL FILE USED IN THE WEBINAR
Common mistakes to avoid when calculating churn
A lot of companies operate on monthly billing, which means you will naturally see monthly recurring revenue on an accrual basis. But for those with a high share of annual contracts, especially where revenue is recognized upfront, you need to break that out over 12 months.
For example, if a customer pays $12,000 in January, you should spread that revenue evenly across the year in your churn calculations.
In these cases, it also helps to separate churn by plan type. You can calculate churn for monthly plans separately from annual plans, or segment the analysis in a way that makes it easier to interpret.
You should also exclude non-subscription revenues. One-off installation fees or professional services should be kept separate from recurring revenue. If someone pays $1,000 for a subscription and $5,000 for setup, that additional amount should not distort your churn or upsell analysis. Track it separately to understand what portion of your revenue is truly recurring.
Another important rule is to use a time frame that gives you stable metrics. Often when we ask about churn, we see wild swings from month to month. For example, 7 percent, then zero, then 12 percent. This usually happens in smaller businesses where just one or two lost customers can heavily skew the numbers. In those cases, I recommend using a trailing 12-month basis. Sum up the lost customers or MRR over the past year and divide by the average starting MRR to get a more consistent figure.
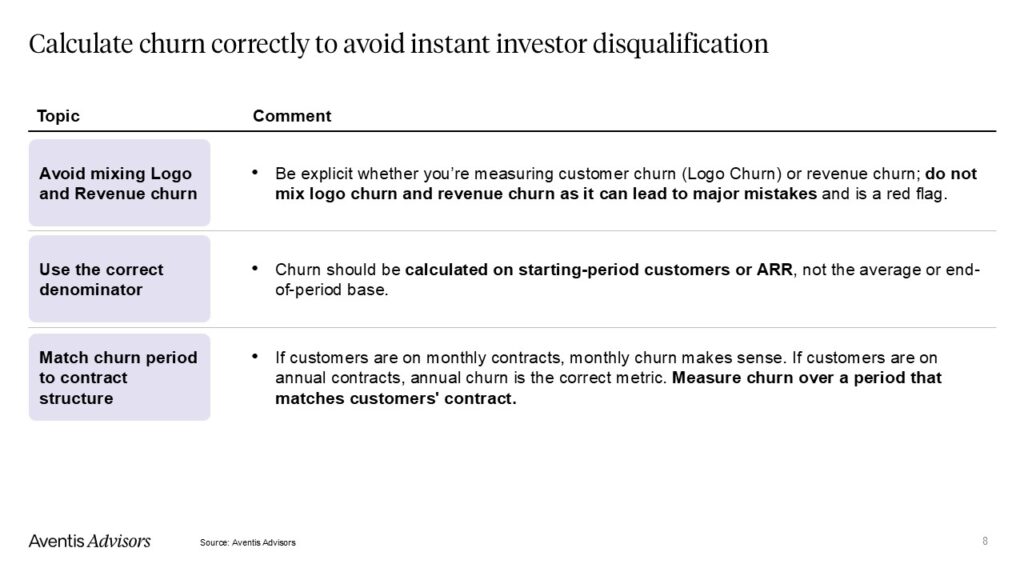
It is also important not to mix logo churn and revenue churn. I recommend calculating both, but prioritize revenue churn for financial modeling. Make sure you are consistent. Do not use logo churn in one report and revenue churn in another without explaining the difference. Mixing them up can cause serious forecasting errors. For example, using logo churn to model revenue can lead to major over- or underestimation.
Another key rule is to use the correct denominator. Always base churn on the number of customers or revenue at the beginning of the period, not the average or the end. You should not include new customers acquired during the month, because they have not had the chance to churn yet.
Finally, match your churn calculation period with your contract structure. If your business mostly uses monthly contracts, calculate monthly churn. If most of your contracts are annual, then annual churn makes more sense. Personally, I like to look at both monthly and annual churn, regardless of the contract type. Different investors or internal decisions may require either view.
These are some of the core rules we use when calculating churn. After explaining this, I moved into the Excel model to show how you can apply these methods in practice. Whether you are tracking internally or preparing for investor discussions, this structure helps a lot. Many of you may already be using tools like Xero, QuickBooks, Stripe, or ChartMogul. If you are happy with the metrics those systems provide, that is fine. But I still recommend cross-checking your churn numbers manually using invoice data. It is the most reliable way to ensure your SaaS KPIs align with your reported revenue.
This matters because billing systems sometimes mix in returns, refunds, or trials. If those are not separated clearly, it can distort your results. Starting from clean invoice data helps you avoid that and gives you a clearer picture.
How to Build a Clean and Accurate MRR and Churn Analysis
We typically start with raw invoice data.
DOWNLOAD THE EXCEL FILE USED IN THE WEBINAR
When we work with invoice data, we know we are focusing only on paying customers and can attribute each record to a real account. The goal is to build a clean MRR bridge and calculate churn as accurately as possible.
We usually start by exporting a basic list of invoices from the accounting system. This includes the invoice date, customer name, invoice value, and whether it’s a monthly or annual payment. Once you have this raw data, you can build a pivot table. I typically use customer names as rows and months as columns. This helps visualize how revenue from each customer changes over time.
In a typical SaaS business, some customers pay every month, some join mid-period, others churn, and some expand or contract their spend. This gives us a clear structure to start calculating new customers, lost customers, and changes in MRR.
For customer-level analysis (logo churn), I look at whether a customer had revenue in one month and then none the next. That indicates churn. If someone had zero in January and started paying in February, that is a new customer. This approach helps calculate the total number of customers, how many joined, how many left, and how the total changed month to month.
For MRR analysis, we use SUMIF instead of COUNTIF. We total up the monthly revenue, add any new MRR, and calculate the net change from customers who continued from one period to the next. That shows upsell or downsell activity. Then we calculate churned MRR for customers who stopped paying.
In our example, the company was relatively flat in customer count but grew MRR during the year. The logo churn averaged 5 percent, while dollar churn averaged 2 percent. This suggests they were losing smaller customers rather than larger ones. The annualized churn came out to 47 percent logo churn and 26 percent dollar churn, which is not terrible but also not ideal. The data used in the example is made up, but it demonstrates the point well.
DOWNLOAD THE EXCEL FILE USED IN THE WEBINAR
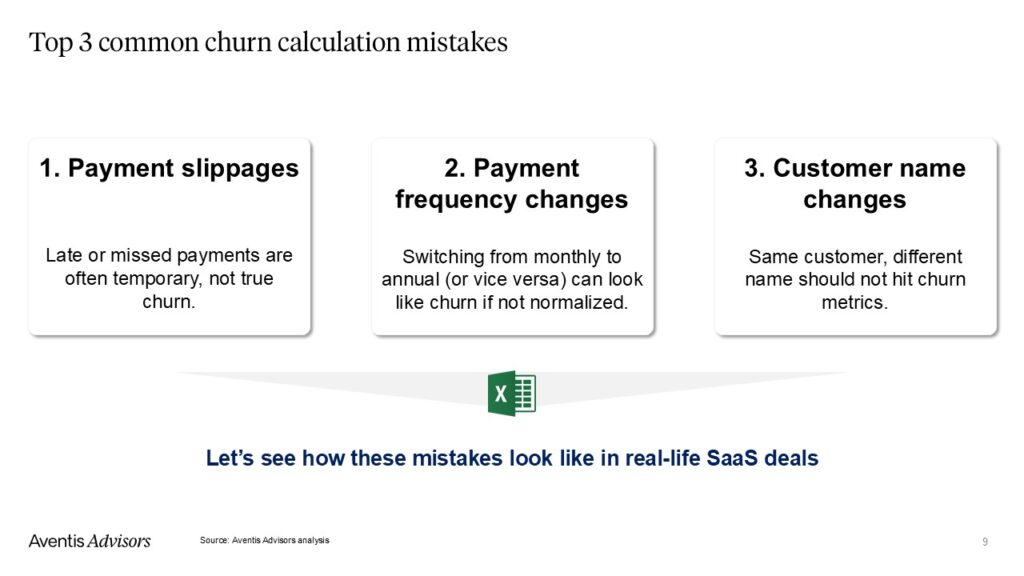
Once you have this raw churn output, it is important to check the accuracy. We rarely see perfectly clean data. There are usually a few areas where correcting the inputs can improve your churn rate significantly, sometimes by several percentage points. Here are three of the most common sources of errors:
1. Inconsistent Customer Naming
This is very common, especially in larger datasets. One month, a customer may be listed as “Apple,” and in another, as “Apple Inc.” In a basic model, this would be treated as a lost customer and a new one, even though it is the same account. Rebrands, name changes, and variations in billing systems can all cause this. If your system uses subscription IDs, you may catch these automatically, but often this needs manual review.
2. Slipped or Delayed Payments
Sometimes customers pay late due to internal processes or contract renewals. For example, a customer may pay $2,400 monthly for a few months, skip one, and then pay $4,800. This likely means they paid for two months at once, not that they churned and came back. Standard formulas might interpret this incorrectly, so you need to catch delayed payments and adjust for them manually. Visual analysis or targeted formulas can help identify these gaps.
3. Switching Between Monthly and Annual Plans
Many companies have customers moving between monthly and annual subscriptions. If you only track one type, it might look like a churn when in fact the customer upgraded or switched plans. For instance, a customer paying $2,000 per month might disappear from the monthly data, but if you check the annual billing, you might find a $40,000 payment. If subscription IDs change during this switch, it might be flagged incorrectly as churn. To get the full picture, you need to track movement between billing cycles.
In our example, after identifying and correcting these three issues – name inconsistencies, payment delays, and plan switches – we reduced churn from 26 percent to 18 percent. That is a big difference, especially in businesses where small changes in churn have a large impact on valuation.
We marked plan switches like “moved to annual” as a separate category. We split invoices where needed, like dividing a Salesforce payment over two months, and we unified customer names manually. These simple steps significantly improved the quality of the churn data, especially for dollar churn.
These three areas are the most common and impactful improvements we’ve seen in practice. Getting them right is essential for accurate forecasting and for presenting a trustworthy picture to investors.
Q&A highlights
Q: For enterprise clients, is there a standard contract length? And what’s a good way to forecast churn before contract expiration?
The best way is simply to stay in close touch with the customer. Most enterprise SaaS companies have account managers who regularly check in – asking if the client is considering alternatives, what challenges they’re facing, or how satisfied they are. That qualitative input is key. Additionally, product usage metrics are helpful. If a customer is approaching renewal but their usage has dropped off significantly, that’s a clear red flag and can be used to forecast potential churn.
Q: What should we do when a customer takes a subscription holiday – pauses for a month or two and then returns?
I don’t consider that churn. I recommend tracking these customers in a separate line – label it something like “subscription holiday” – and just subtract those months from your MRR to make sure your bridge adds up. But don’t include them in churn calculations. Treat it more like a temporary down-sell. Investors may factor it into their forecasting since it reduces revenue visibility, but it shouldn’t be considered actual churn.
Q: Can we get access to the Excel model you used to play around with the assumptions?
Yes, we’ll be sharing the deck and the Excel model so you can experiment with the assumptions yourself.
Q: When converting monthly churn to annual churn, should we just multiply by 12? Or is compounding better?
You should definitely use compounding. There’s a proper formula for that: Annual churn = 1 – (1 – monthly churn)¹²
It’s especially important if you have higher monthly churn rates, where the difference becomes more significant.
Closing remarks
If you have your own numbers, MRR sheets, or churn calculations and want some input, feel free to reach out. Often, when we review these, we are not just looking at the numbers. We also give feedback on your overall business strategy. For example, we might notice that your churn rate is too high for your CAC, or that you’re not investing enough in growth even though you have a low churn rate.
When churn is low, it often makes sense to overinvest and tolerate short-term losses because the long-term payback is strong. We are happy to help you think through those trade-offs.
Thanks again for joining. If you have feedback on the session or ideas for future topics, I would love to hear it. And feel free to share this with your finance or operations teams as well.
Have a great rest of the day!